About the course
- Introduction to AI and machine learning in the Energy Sector
- Data pre-processing and visualization
- Supervised learning
- Linear and regularized regression models
- Decision Trees, bagging and boosting
- Neural Networks and back-propagation
- Deep Learning
- Unsupervised learning
- Clustering
- Dimensionality reduction
- Reinforcement Learning
Reference material
- Class notes
- Trevor Hastie - An Introduction to Statistical Learning: with applications in Python. Available at https://www.statlearning.com/
- Aurélien Géron - Hands on machine learning with scikit-learn and pyTorch. Available at https://github.com/ageron/handson-ml3
- Andrew Barto and Richard S. Sutton - Reinforcement Learning: An Introduction (MIT Press, Cambridge)
- Anoop Krishnan, Hariprasad Kodamana and Ravinder Bhattoo - Machine Learning for Materials Discovery (Springer)
- Christopher M. Bishop - Pattern Recognition and Machine Learning (Springer)
Energy Transition

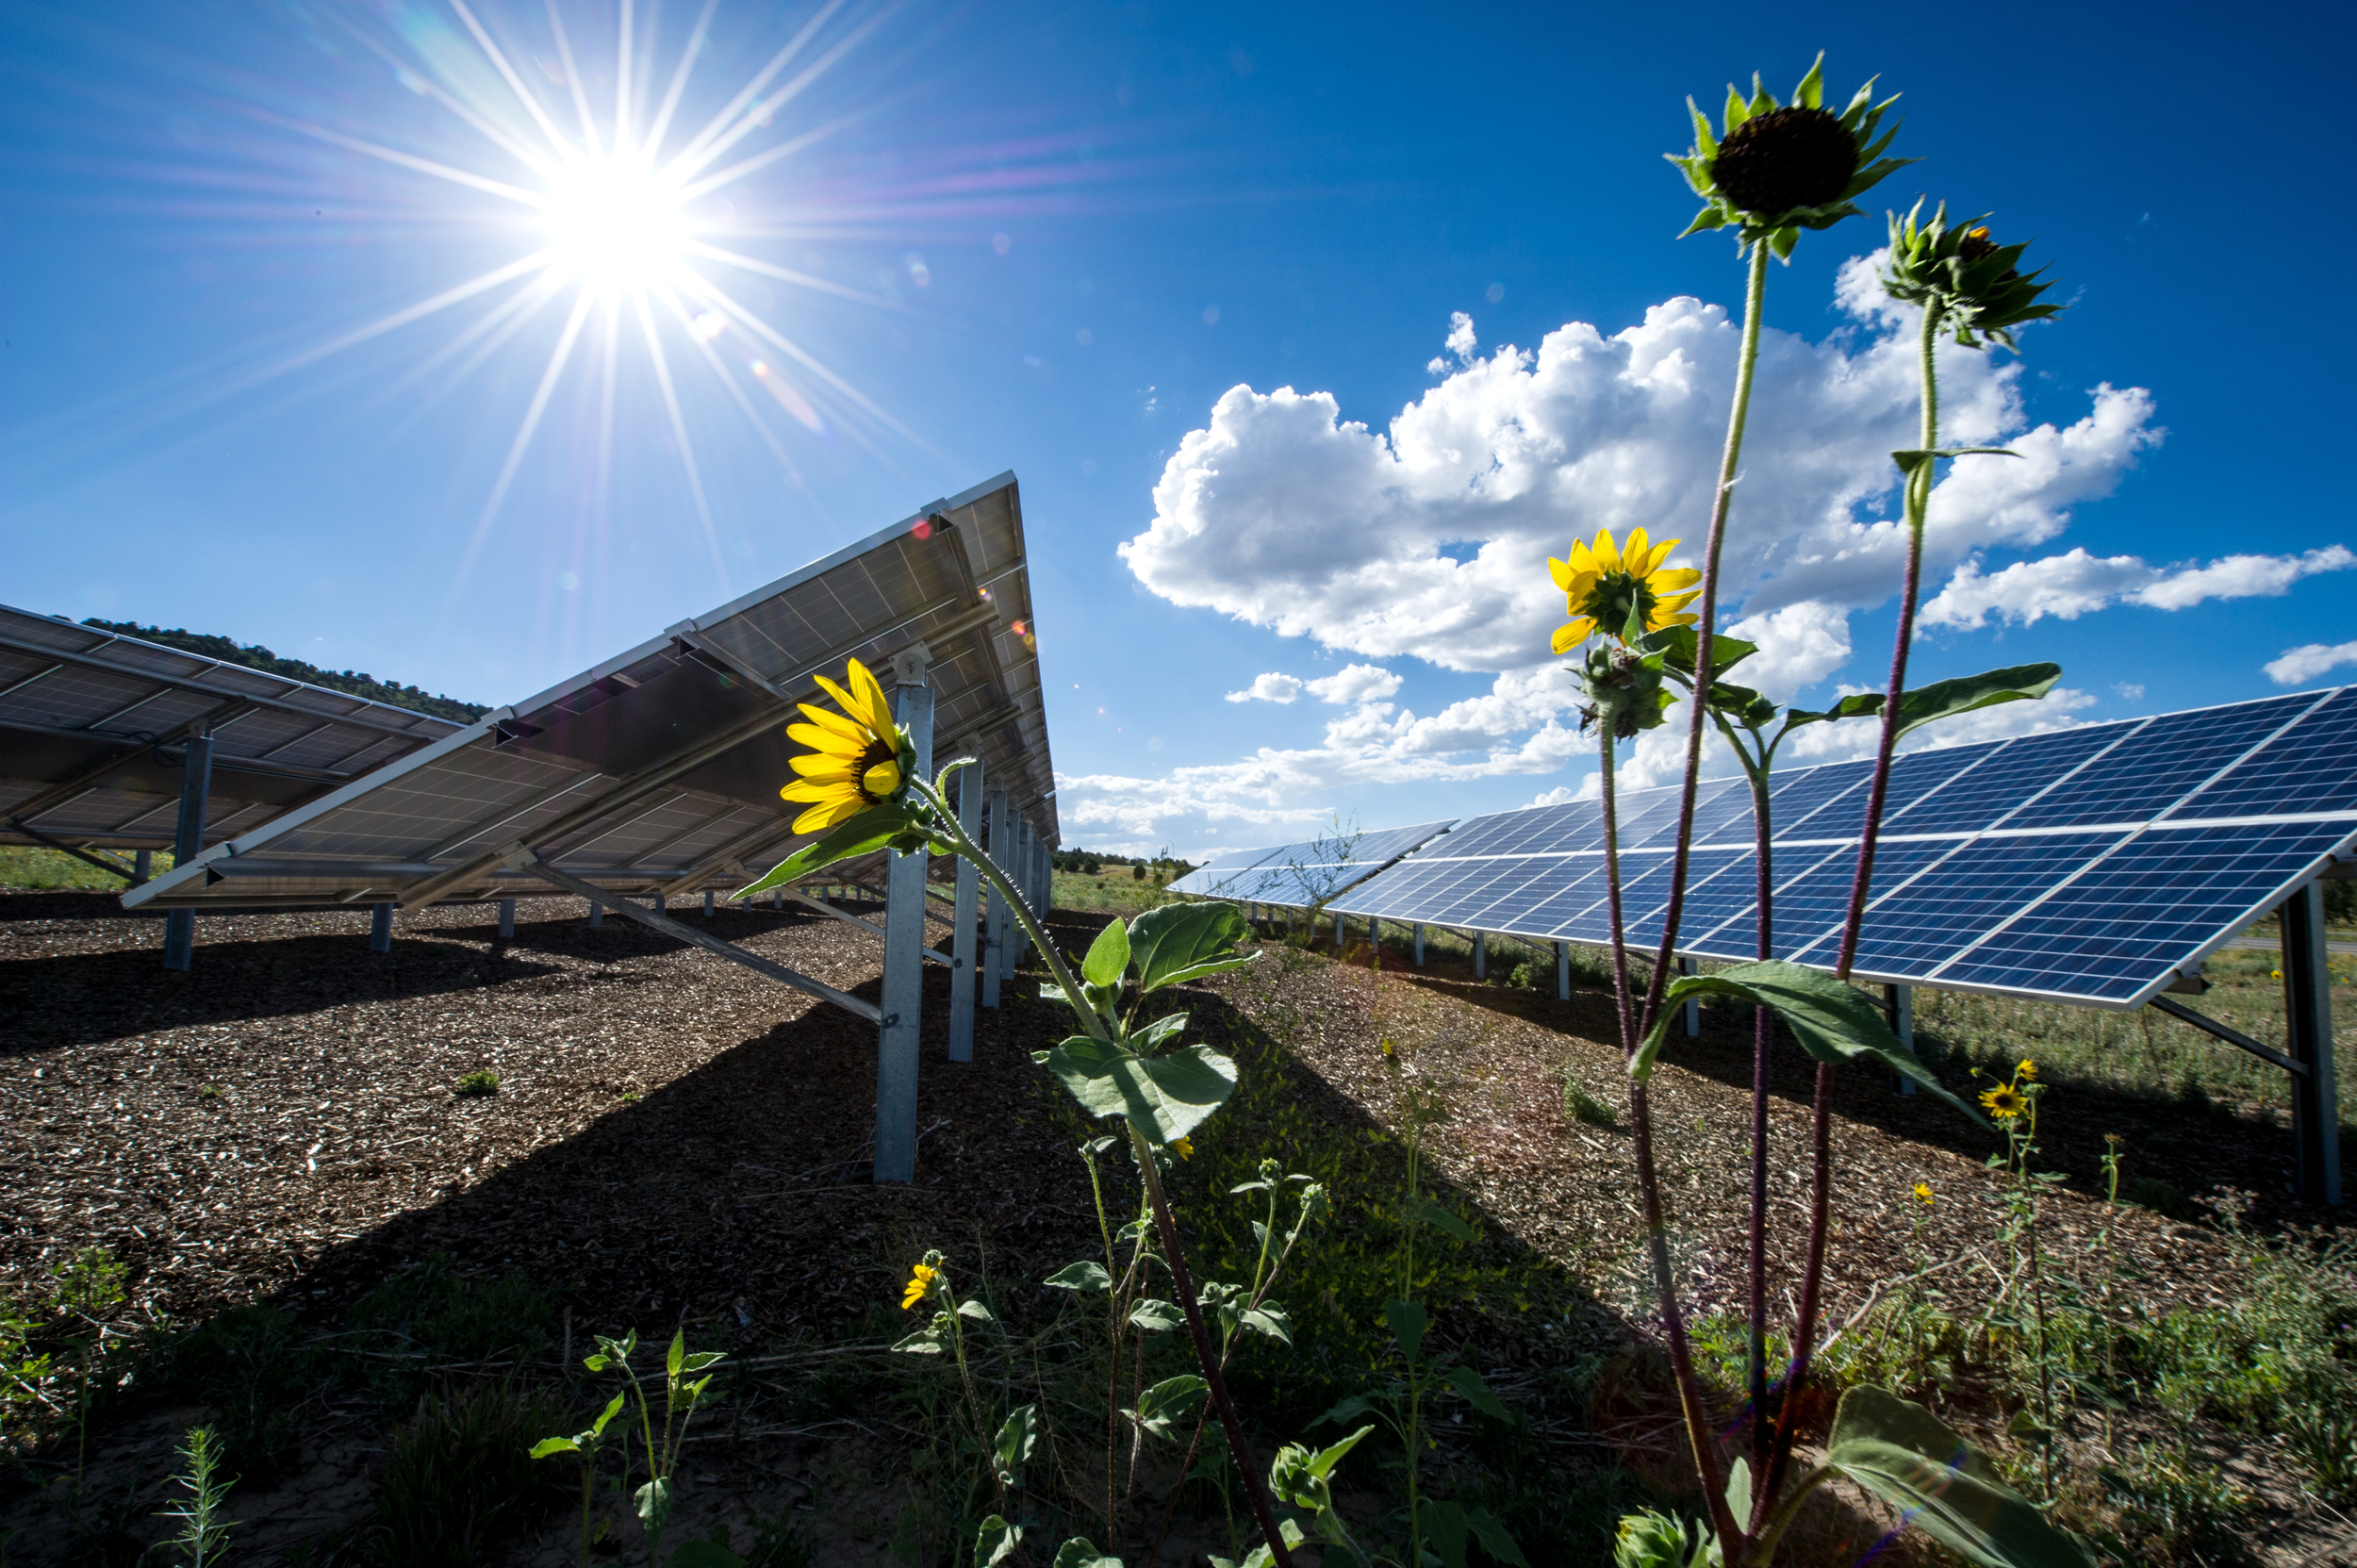
Energy
- Powers everything from molecular interactions to large scale infrastructure on Earth.
- Transitioning to sustainable energy systems is required for persistence of human life and environment as we know it.
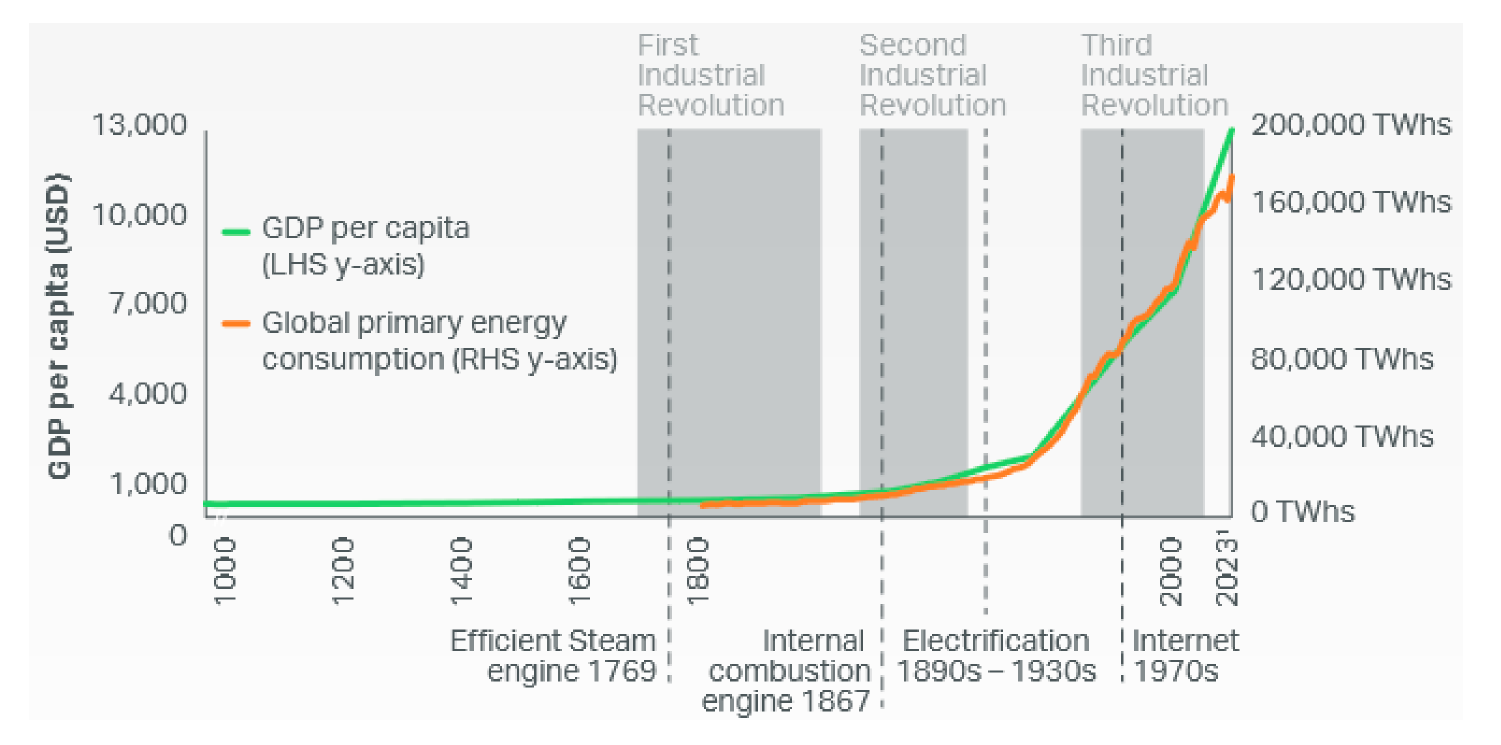
Innovation and energy that fuelled it underpins economic growth
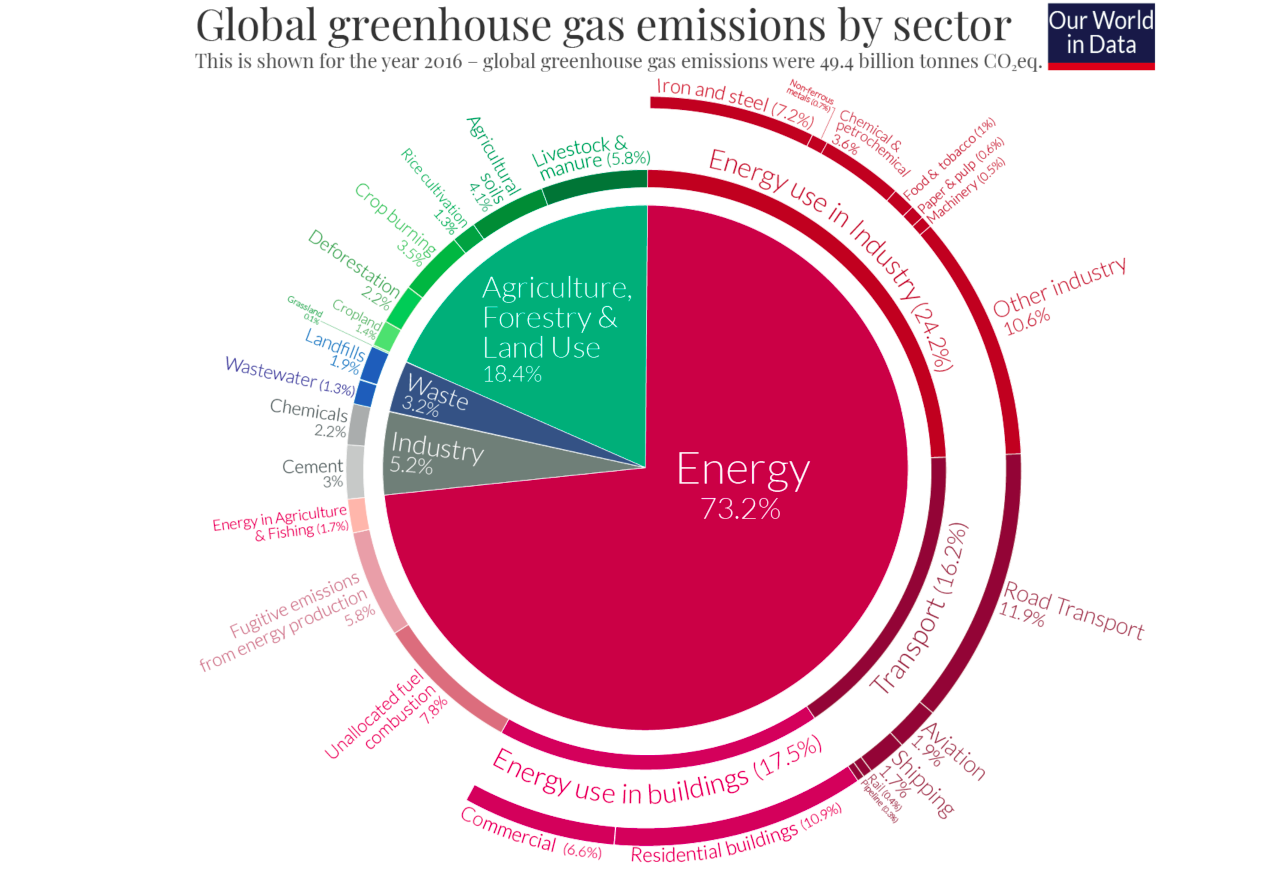
Current Issues
Energy transition
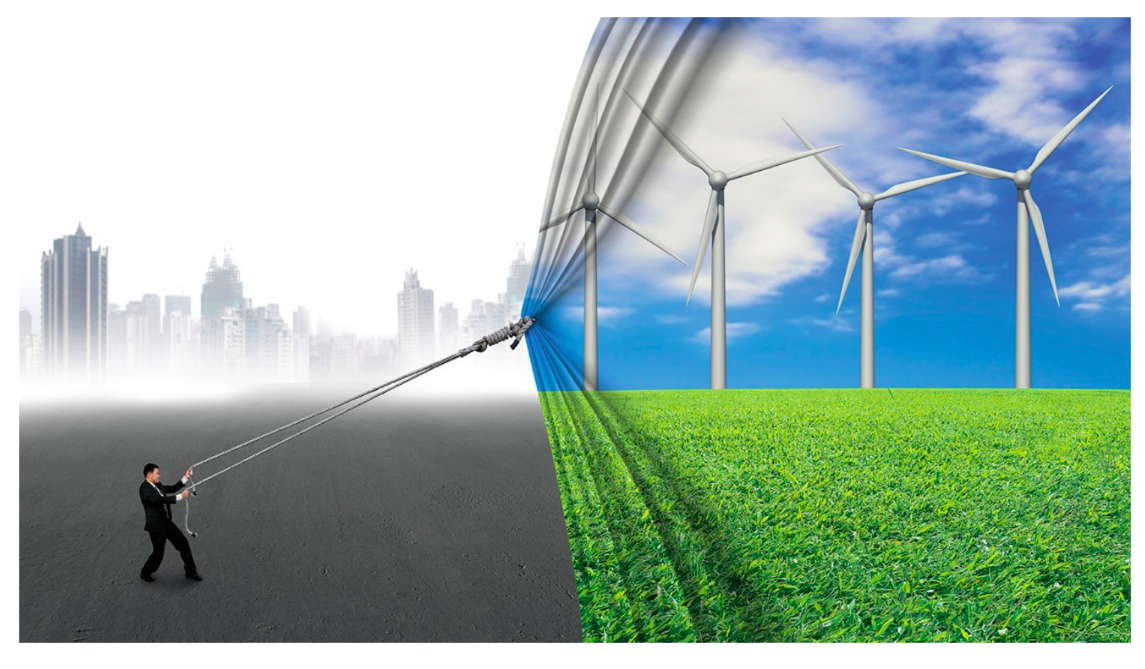
Energy transition
- Structural shift from fossil-based (coal, oil, gas) to low or zero-carbon sources (renewables, nuclear, potentially hydrogen)
- More than swapping sources: involves change in infrastructure, technology, policy, markets and consumer behavior
Key Goals
- Decarbonization
- Sustainability
- Reliability and Resilience
- Affordability and Accessibility
Opportunities and Challenges
Opportunities
- Capture market share
- Enhance competitiveness
- Expand into new markets
- Improve environmental quality
Challenges
- Trade-offs between economic, environmental and social aspectsRegulatory and policy barriers
- Burden shifting across space, time, impact categories and disciplines
- Complex system dynamics and deep uncertainties
Objectives
- Develop systematic methods, models and tools to guide transition to net-zero, nature-positive, and people-positive engineering
- Emphasis on process industries
Vision
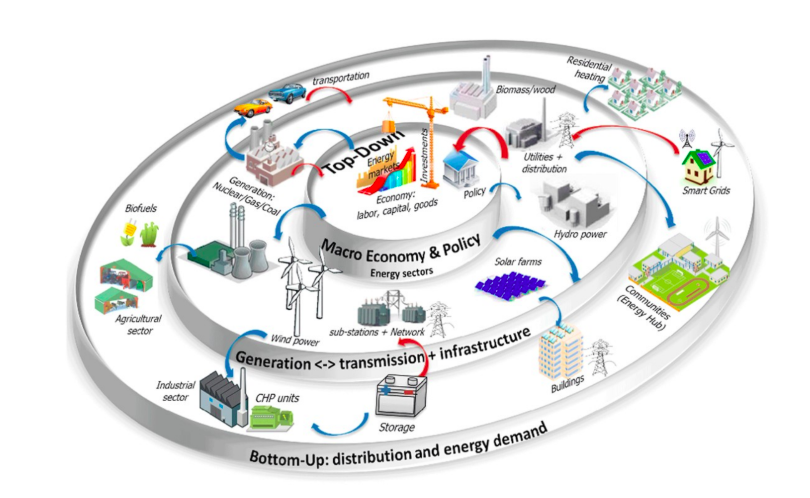
- System level: more electric, distributed resources, variable generation
- Operational level: more resilient, efficient solutions with righ infrastructure
- Pathway 1-CCS: carbon capture and storage for decarbonization
- Pathway 2-RE: Renewables as clean energy
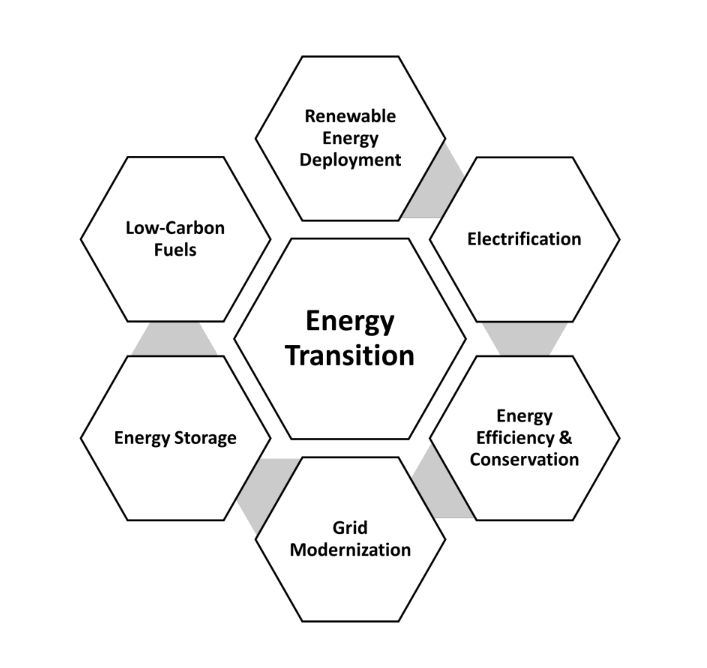
The pillars of transition
The classes of problems
- Optimization problems
- Control problems
- Simulation problems
- Decision problems
- Uncertainty quantification problems
- Learning problems
- Multiscale problems
How AI could offer solutions
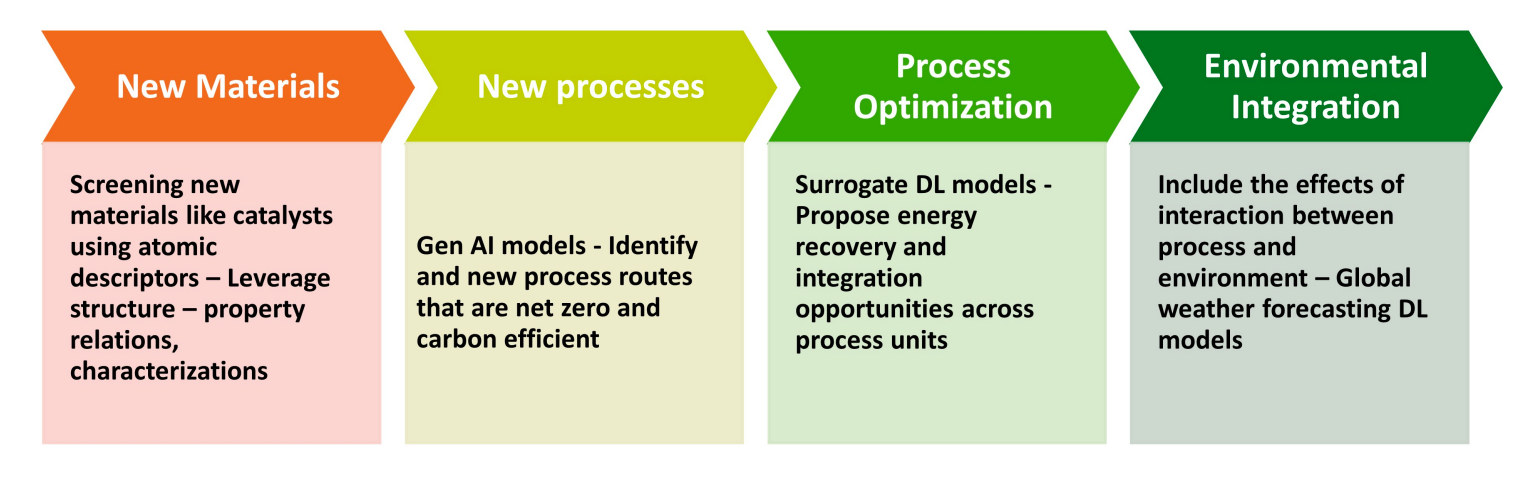
AI will act as an accelerator for this transition.
AI Models: Understanding, Prediction and Creation
- Traditional AI tasks - understanding or discriminating between existing data points (e. g., classification and regression)
- AI tasks for prediction - forecasting future data points (e. g., time series prediction, demand forecasting)
- AI tasks for creation - Gen AI (e. g., new process routes, new materials, reducing boilerplate tasks)
Data in Energy Systems
- Types of energy data:
- Time series data (load, generation)
- Spatial data (wind farms, grids)
- Graph-based (power networks)
- Issues:
- Missing data
- Measurement noise
- Non-stationarity
- Physical meaning of data
What makes energy AI different from Generic ML
- Physical constraints (conservation, limits, non-negativity)
- Safety-critical decisions (small error ->cascade failures)
- Long time horizons (e.g. battery degradation, error compounding)
- Policy & economics coupling (multiphysics, predictions change consumer behavior)
- Interpretability requirements (Regulators need reasons for decisions)
AI models and role of human judgment
- Understand the mathematical basis for ML
- Recognize stregnths and limitations
- Prepare for python based assignments
Physical models vs Data-driven models
| White box models | Black box models | Gray box models |
|---|---|---|
| Examples: heat conduction using heat equation, power-flow in transmission, electrochemistry of Li-ion batteries | Examples: Neural network mapping weather->PV power, Random forest predicting buildin consumption, surrogate for CFD of wind farmsification, | Examples: Energy conservation + ML terms, ML-based closure in turbulence, battery degradation with learned parameters |
| Interpretable, extrapolates beyond data, trusted, but expensive, hard to calibrate | fast inference, scales well but hard to trust in safety-critical settings | Better generalization, but requires domain expertise |
Errors, Uncertainty and Risk
- Mean error vs. worst-case error
- Cost of errors
- Uncertainity matters more than accuracy
- Predictions can be deterministic vs. probabilistic
- Energy decisions are risk-based and not error-based.
Anatomy of an ML model
- Inputs (features): Measured (derived), e.g, wind speed, irradiance, occupancy in a building, temperature, current
- Raw features may have a lot of redundancy
- Outputs (targets): The quantity the model predicts, e.g, Power output, demand, system state, remaining life of assets. Derive decisions based on output.
- Model structure (hypothesis space): Mapping from input to output. E.g., Linear regression-weighted sum, NN-nonlinear transformations.
- Parameters: What the model learns. E.g., Weigts, thresholds
- Loss function: Measure of prediction error. E.g., mean squared error, cost weighted loss
- Training: Process of adjusting the parameters so the model becomes accurate
- Inference: Using the model on unseen data
- Generalization: Performance on unseen conditions. E.g., Heatwave conditions not seen in data, New grid topology.
- Uncertainty & Confidence: Quantifying how sure the model is. E.g., forecast bands, risk-awareness
Python examples
- Use google colab if you have, otherwise the links are shared here:
Prediction example
Forecast example
Python language as a thinking tool
We will use Python as:- Experiment notebook
- Analysis tool
- Simulation tool
So you must learn to use a python instance in Google Colab or similar. Know basic computing ideas like variables, conditional statements, instructions, data types, input/output.
What is learning from data?
- Model estimation methods
- Bias and variance tradeoff
- Model accuracy
What is a model?
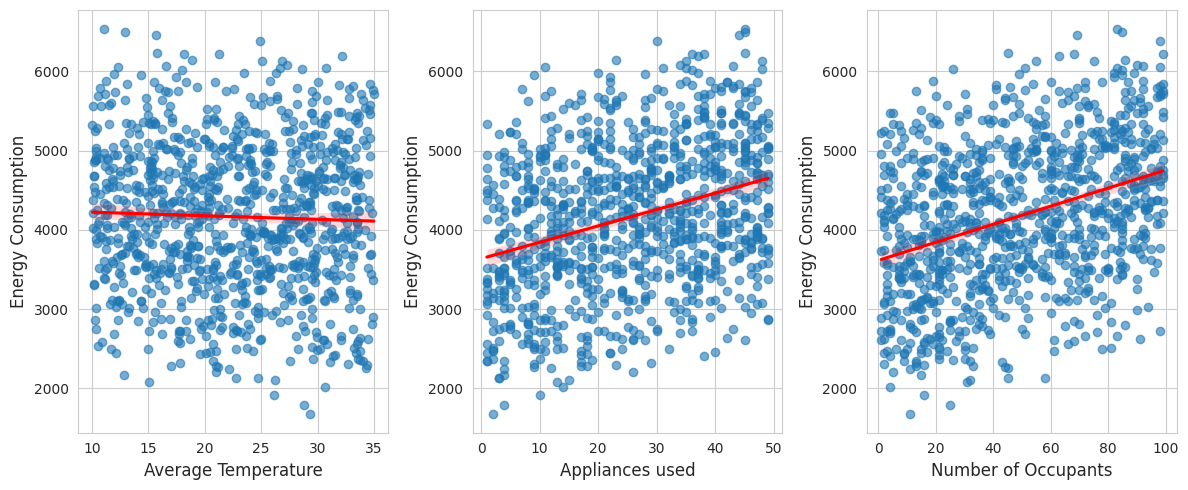
- Goal: Predict energy consumption for building
- Inputs: Sq. footage, occupants, appliances, temperature, day of week
- Outputs: Energy consumption
- Model: $Y= f(\mathbf{X}) + \epsilon$, where $\mathbf{X} = (X_1, X_2, \cdots, X_p)$
- $f$ is fixed by unknown. $\epsilon$ is random error, independent of X, mean zero.
- $f$ is systematic information that X provides about $Y$
Simpler example
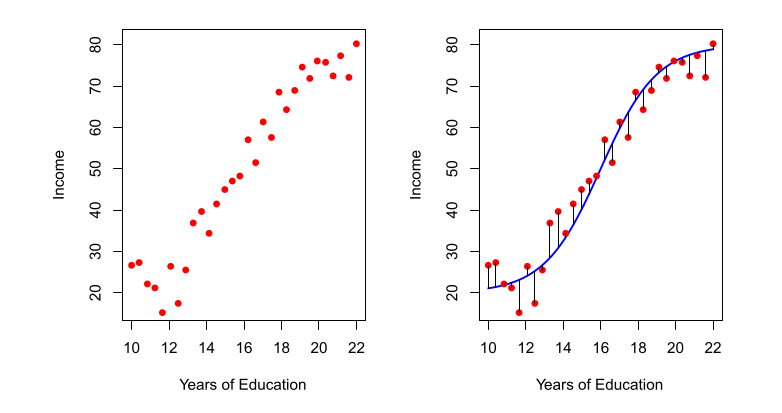
Estimating f
- We may estimate f from given data as $\hat{f}$ and so $$ \hat{Y}=\hat{f}(\mathbf{X})$$
- $\hat{f}$ is an estimate of $f$, $\hat{Y}$ is resulting prediction of $Y$
- Hence the accuracy of $\hat{Y}$ as a prediction for $Y$ depends on:
- reducible error
- irreducible error
- Reducible: reduced by making $\hat{f}$ a perfect estimate of $f$
- Irreducible: Even if we get $\hat{Y}=f(\mathbf{X})$, there will be some error because $Y= f(\mathbf{X}) +$ $\epsilon$
- $\epsilon$ is either unmeasured variables or unmeasureable variation.
Prediction
- Consider an estimate $\hat{f}$ and predictors $\mathbf{X}$, yielding $\hat{Y}=\hat{f}(\mathbf{X})$
- Assume, $\hat{f}$ and $\mathbf{X}$ are fixed, and $\epsilon$ is random wit expectation 0.
Expectation is the arithmetic mean for equally likely events, the weighted mean for unequal
events, and the first moment of the pdf in the continuous case (when it exists).
Statistical Inference or interpretation
- Questions: Which predictors are associated with the response? Which are important?
- Relationship between the predictors? Positive or negative association?
- Can relationship between $Y$ and each feature be adequately summarize using linear functions? When is linear not adequate?
- Which factor contributes the largest to building energy use?: How much more energy will be consumed if I increase occupancy by 10%?
- Linear models are more interpretable.
Estimating $f$: Parametric forms
- Make an assumption on the mathematical form. E.g. $$ f(X) = \beta_0 + \beta_1 X_1 + \beta_2 X_2 + \cdots + \beta_p X_p $$
- Above assumes a linear function with parameters $\beta_0, \beta_1, \beta_2, \cdots, \beta_p$
- Use training data to fit/train the model such that $$Y \approx \beta_0 + \beta_1 X_1 + \beta_2 X_2 + \cdots + \beta_p X_p$$
- The problem of estimating $f$ simplifies to estimating the parameters $\beta_0, \beta_1, \beta_2, \cdots, \beta_p$
- Disadvantage: The model may be far from the true form of $f$
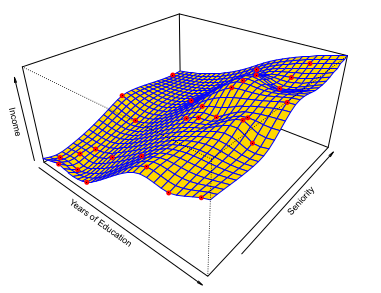
- Then we could use flexible models: but causes overfitting.
Linear fit
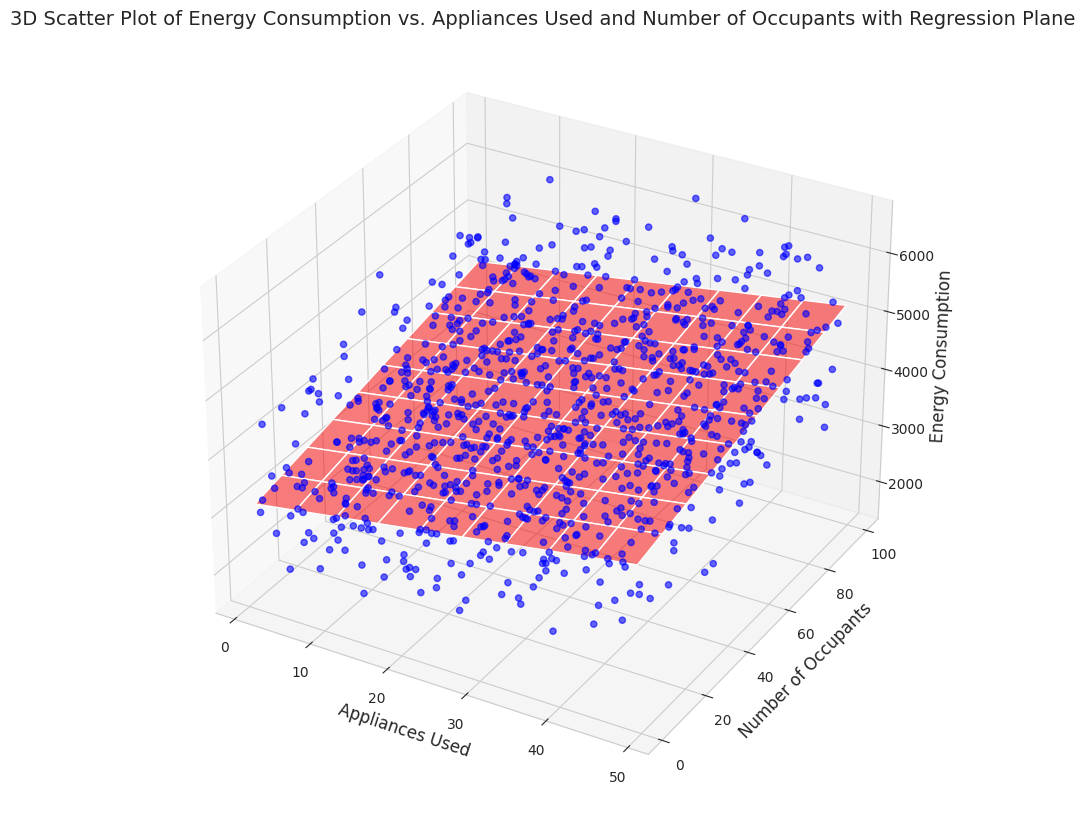
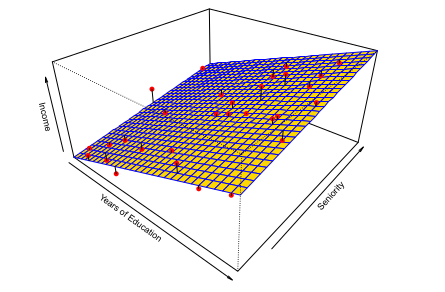
- Model will usually not match the true unknown form of $f$.
- A more flexible model-more parameters-leads to over fitting
Non-parametric forms
- Seek an estimate of $f$ that gets as close to the data points as possible without being too rough or wiggly
- No assumption about the form of $f$
- A very large number of observations needed
- Fitting vs overfitting:
Smooth spline fit
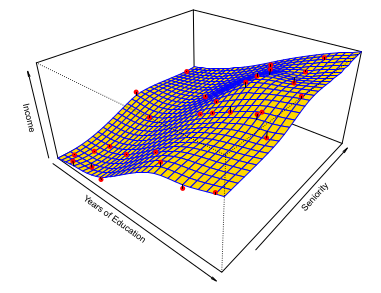
Rough spline fit
Accuracy vs Interpretability
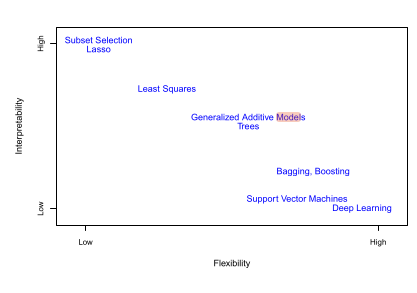
- Linear regression is inflexible, whereas splines are flexible. Then why use a linear model?
- Better interpretability. it will be quite easy to understand the relationship between $Y$ and $X_1 , X_2 , \cdots X_p$
- Sometimes the less flexible model is also better for accuracy (potential for overfitting in higher flexibility models).
Model accuracy
- How do we measure performance of a learning method?
- Regression:mean-squared error $$ MSE = \frac{1}{n}\sum_{i=1}^{n}(y_i - \hat{f}(x_i))^2$$
- Common loss functions include mean squared error, mean absolute error, and root mean squared error
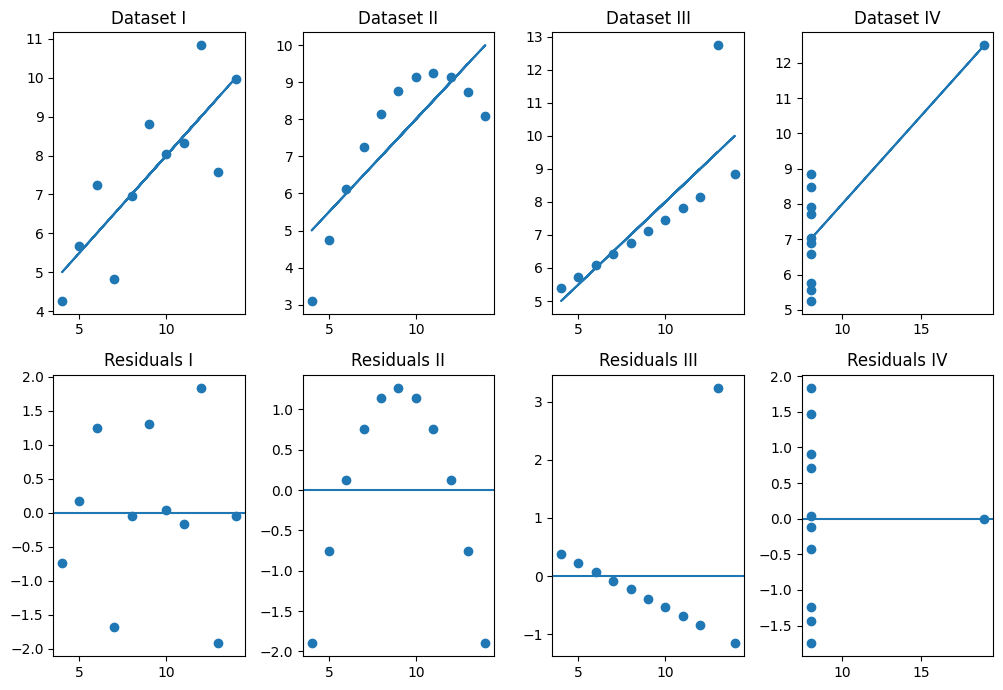
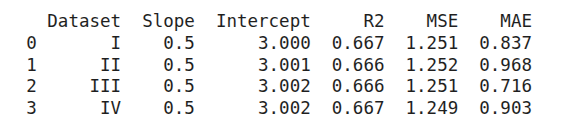
Sometimes you need more than MSE
Test MSE vs Train MSE
- we are interested in the accuracy of the pre- MSE dictions that we obtain when we apply our method to previously unseen test data
- Examples: Stock profile, patient data
- Given a model trained on $\{ (x_1,y_1), (x_2,y_2), \cdots, (x_n,y_n) \}$, i.e. $\hat{f}(x_1), \hat{f}(x_2), \cdots, \hat{f}(x_n)$.
- We want to know how well $\hat{f}(x_0)$ predicts $y_0$.
- Ave$(y_0 - \hat{f}(x_0))^2$ for all such $(x_0,y_0)$.
- What if we don't have test data? Can we rely on train MSE?
- But training MSE could be quite small while test MSE is large.
Test vs Train MSE
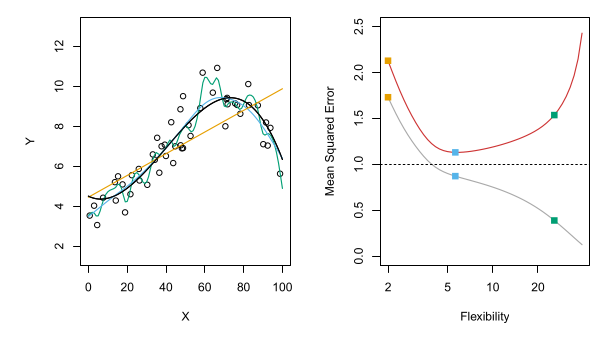
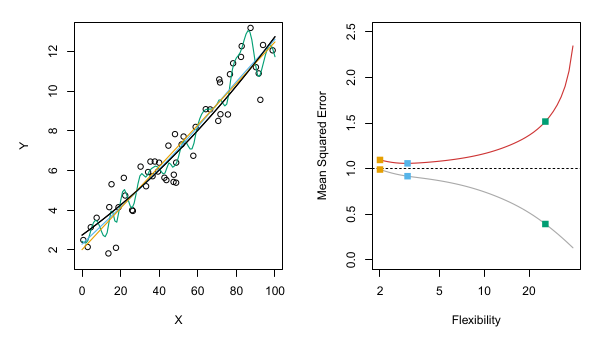
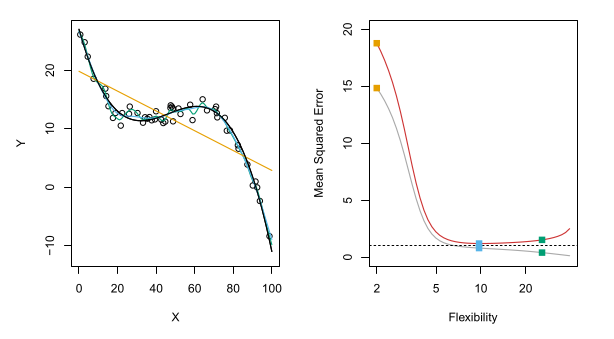
- Grey lines:train MSE, red lines: test MSE. Blue and green lines: spline curves with increasing degrees of freedom.
- The horizontal dashed line indicates Var($\epsilon$), the irreducible error, which corresponds to the lowest achievable test MSE among all possible methods. Hence, the smoothing spline repre- sented by the blue curve is close to optimal.
- monotone decrease in training MSE vs. U-shape in test MSE.
Bias-variance tradeoff
- The U-shape in test MSE: two competing properties.
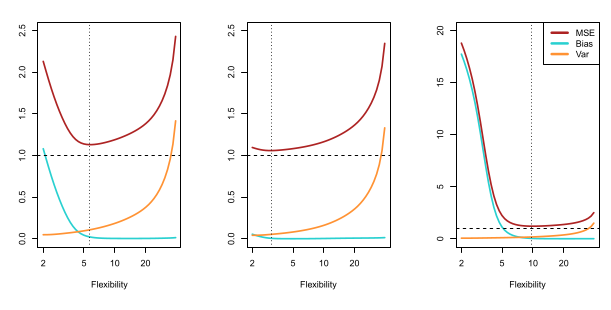
- $E(y_0 - \hat{f}(x_0))^2 = \text{Var}(\hat{f}(x_0)) + \left[\text{Bias}(\hat{f}(x_0))\right]^2 + \text{Var}(\epsilon)$
- Variance: amount by which $\hat{f}$ would change if we changed the training data.
- Different training data, different $\hat{f}$.
- Linear fit has less variance.
- Bias: Error due to simplification. Linear regression has large bias.
- High flexibility - high variance, low bias.
- Low flexibility - low variance, high bias.
More examples
More examples
Data loading demo
Google Colab notebookSupervised vs. Unsupervised learning
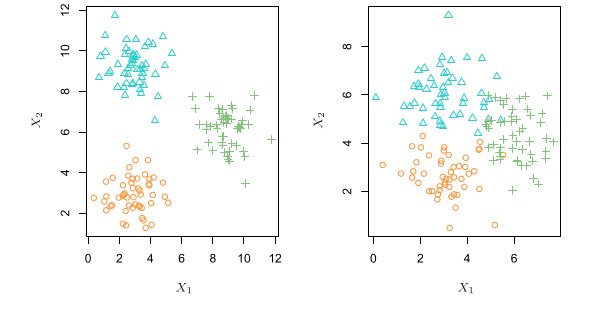
- Unsupervised: given observations $x_1, x_2, \cdots, x_n$, find if data falls into groups
- Example: [wind speed, direction, power output, rotor speed, blade pitch angle, nacelle temperature, vibration indicators]
- Labels could be: [normal op., wake loss, icing, curtailment, incipient fault]
- Existense of semi supervised learning.
Model accuracy in classification
- Suppose we seek to estimate $f$ on $\{(x_1,y_1), (x_2,y_2), \cdots, (x_n,y_n)\}, where $y_1, \cdots, y_n $ are qualitative.
- Training error rate: mistakes made: $$ \frac{1}{n}\sum_{i=1}^{n}I(y_i \neq \hat{y}_i).$$
- Test error rate: Ave $(I(y_0 \neq \hat{y}_0))$ for all $(x_0,y_0)$.
Regression vs. classification
Classifier Accuracy
Assignments
- Assignment 1: Use any of the sources from below:
- IEA Energy Transition reports (executive summaries)
- IPCC WGIII Summary for Policymakers
- National grid or utility annual reports
- NREL fact sheets
- Government energy dashboards
- Renewable intermittency
- Grid congestion
- EV charging infrastructure
- Building energy efficiency
- Battery degradation
- Climate-driven extreme events
- Describe the energy-transition problem in your own words.
- What part of this problem might AI help with?
- What part should not use AI?
- Identify: Inputs (features), Outputs (targets), ML paradigm (regression, classification, RL, etc.)
- Would you use: White-box, Black-box, Gray-box. Explain why.
- What happens if the AI model is wrong?
- Which errors are most dangerous? What data is required? Would a regulator trust this model?